Conventional measures of military strength tend to focus on quantity, the number of fighter jets, naval vessels or submarines – not how effective they are. And they also focus on a country’s spending on military. However, the current measurement system doesn’t make any allowances for the sophistication and capabilities of high-tech military capability. A modern F-35 aircraft has stealth capabilities, highly advanced radar technology, and superior data sharing and data processing power compared to older fourth generation fighter jets, such as the Su-27 or F-16. This same principle applies for other military assets as well.
Now, in the Contemporary Trends in Militarisation Report, a first-of-its-kind military capability analysis by the Institute for Economics & Peace, a country by country comparison has been adjusted according to the technological differences between military assets. Against a backdrop of an increasing level of global militarisation, IEP’s report examines trends in militarisation expenditure, plus introduces the Military Technology & Capability (MTC) scoring system. The combination of these two provides a more accurate way to assess military power balances.
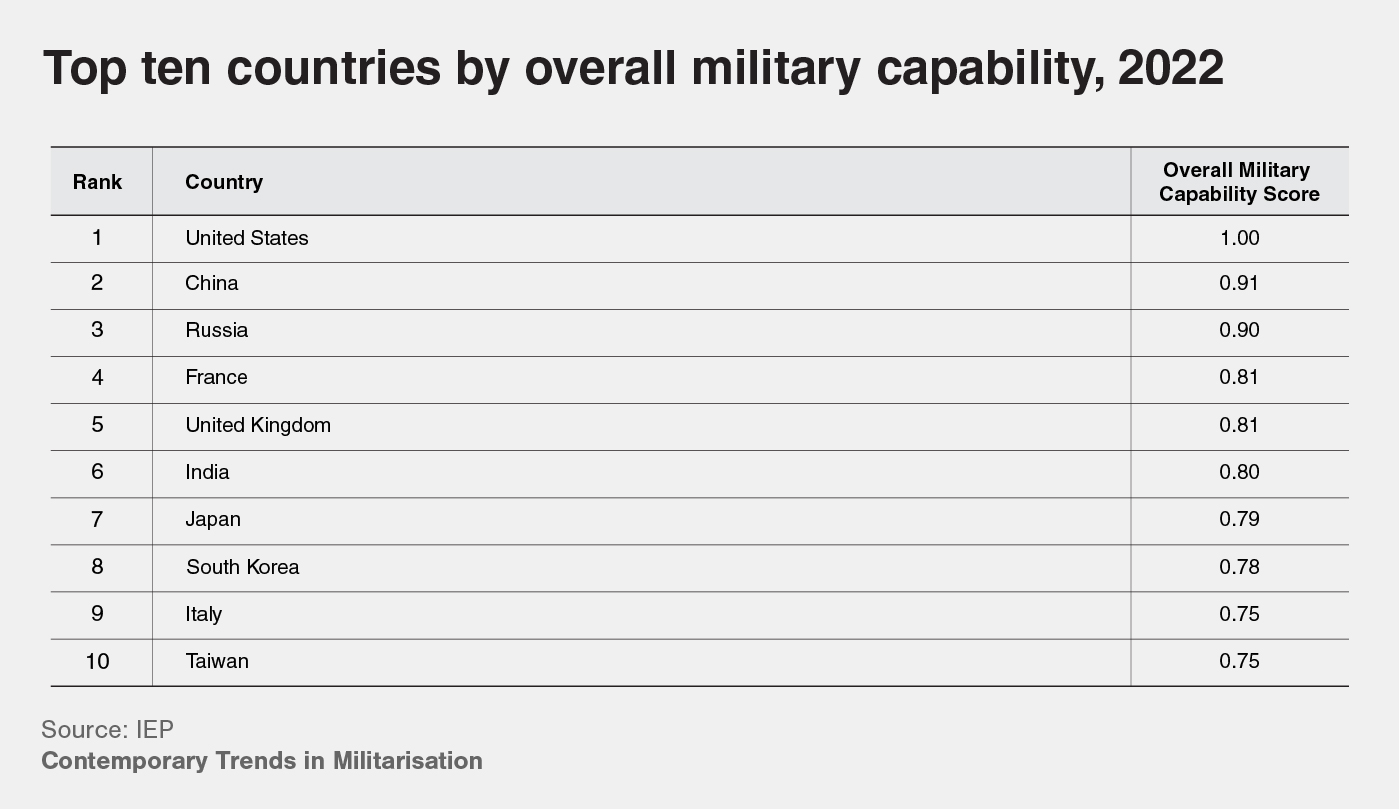
The US has the highest capability score, up to three times China, which ranks second. Russia follows China closely in third. Countries such as Iran and North Korea, despite having large fleets of fixed wing planes, drop considerably in the rankings, because their assets represent older technology.
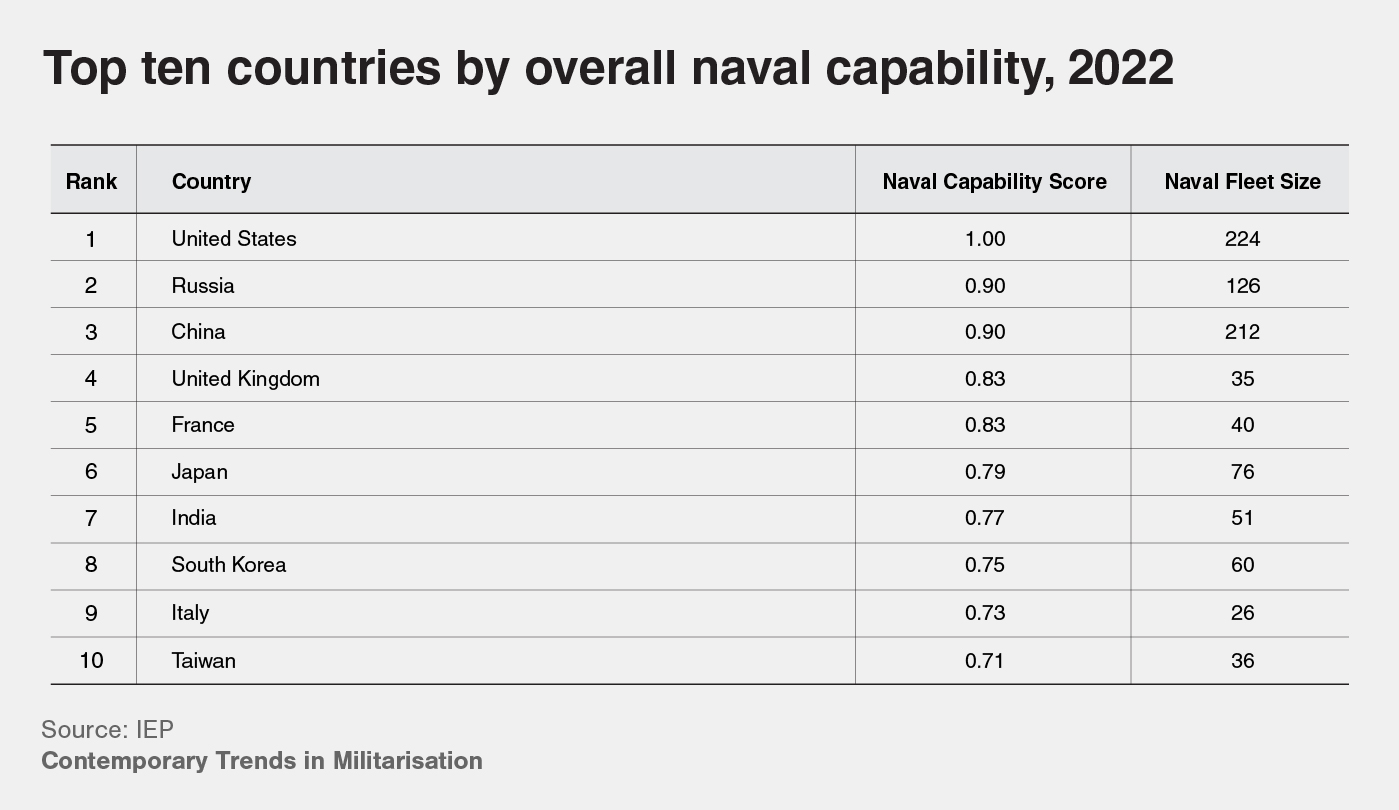
The US also has a much higher level of naval capability than any other country, with Russia having the second highest level. Although the size of China’s fleet is almost as large as the US, the quality of its fleet means that it is in third place. The key factor explaining Russia’s higher naval capacity than China is its significantly larger fleet of ballistic missile nuclear submarines. China’s navy boasts a large fleet of frigates and corvettes, however these are awarded fewer points than other naval assets such as aircraft carriers, nuclear submarines, cruisers, amphibious assault ships, and destroyers.


These trends occur as the world is at a crossroad with the number of conflicts, 59, at an all-time high since WWII. These conflicts are becoming more internationalised, with 92 countries involved in a conflict beyond their borders, rising competition between the major powers, and more middle level powers also becoming more assertive. Unresolved conflicts are at the highest levels since WWII, opening more opportunity for major conflicts to erupt, as reported in the Global Peace Index 2024 (GPI).
While military expenditure is rising in absolute terms, as a percentage of GDP it has fallen and is around half of the peaks seen at the height of the Cold War. Concurrently, as military sophistication increases, troop numbers are declining, highlighting a growing reliance on technology.
Despite rising military expenditures, the total number of military personnel globally has fallen from over 30 million in 1995 to under 28 million in 2020, in line with increased technological capabilities. On a per capita basis, the decrease is even more pronounced, dropping from close to 700 per 100,000 people in the early 1970s, to 350 in 2020. Countries are allocating more funds to their militaries, yet the number of service members is at an all-time low.
India was the only major power to see an overall increase in its total number of troops, however its number of troops as a percentage of the labour force remained constant. The US, Russia, and China all recorded large falls in total troop numbers.
In response to global instability, national and global military expenditures have been steadily increasing. In 2023, global military expenditure reached a record high of $US2.443 trillion, marking a 6.8 per cent rise from the previous year. This increase was driven by reactions to the ongoing conflict in Ukraine and escalating geopolitical tensions in Asia, Oceania, and the Middle East. In 2023, the GPI recorded that 104 countries had increased their militarisation, the largest number since the inception of the Index in 2008.
In terms of military expenditure as a percentage of GDP, it had been gradually failing for the first 14 years of the GPI. However, this trend reversed in 2022 after the invasion of Ukrainian war. In 2023 military spending as a percentage of GDP increased in 86 countries compared to 50 where it decreased.
Broadly, increases in military spending divert funds away from other public goods such as education, health and business development. Studies have shown that higher military expenditures are negatively associated with developmental indicators of health, wealth and education. Conversely, they are positively correlated with mortality and poverty rates, and air pollution. This is due to the reallocation of funds away from healthcare and infrastructure towards the military.
The relative share of global military capabilities is now more dispersed. The permanent members of the UN Security Council account for less than 50 per cent of global material capability, down from 75 per cent at the end of WWII.

The evolving landscape of warfare has led to the development of more sophisticated and powerful weapon platforms that are smaller and relatively less expensive. For example, Ukraine’s use of FPV drones has proven effective against Russia’s formidable artillery forces. This shift may help explain the counter trends of increasing military spending alongside reduced personnel numbers. Technological substitution may be reducing the need for larger armed forces.
In the fixed-wing aircraft category, the MTC used a point system for fighter jets and bombers based on their generation and technological capacity. For instance, a fifth- generation fighter jet is assigned a score of 50, while a 4.5-generation counterpart receives a score of 25. Other types of fixed-wing aircraft are assessed using a simpler scoring system.
The points system also takes into account the battlefield experience and combat readiness of air forces. Battlefield experience measures an air force’s recent involvement in combat, while combat readiness assesses its ability to maintain operational readiness over an extended period.
For naval capability, IEP implemented a scoring system for various key classes of naval assets, including nuclear submarines, aircraft carriers, cruisers, destroyers, and amphibious assault ships. For example, an aircraft carrier receives the highest score of 2,000, followed by a nuclear submarine with a score of 1,500.
Different types of assets within one class are also scored based on their technological capacity and lethality. For example, for aircraft carriers, characteristics such as battlefield experience, aircraft capacity, aircraft launch and recovery systems and flight deck size, and configuration are used to gauge the difference between different kinds of carriers. Based on these criteria, a Gerald Ford-class aircraft carrier, the largest and most advanced of its kind, is given a perfect score of five out of five.
The final two categories in the new scoring methodology are rotary wing assets and armoured vehicles. As there are many different classes and categories for both of these asset types, a more simplified scoring system is used compared to fixed wing and naval assets.
The Military Technological & Capability Score provides an important complement to traditional measures of military strength. While technological advancements do not guarantee battlefield dominance, they significantly shape the nature of warfare.